> ## Documentation Index
> Fetch the complete documentation index at: https://docs.covianalytics.com/llms.txt
> Use this file to discover all available pages before exploring further.
# Actions Dashboard
> Monitor the status of all actions across your organisation, identify overdue items, and track trends over time.
## Overview
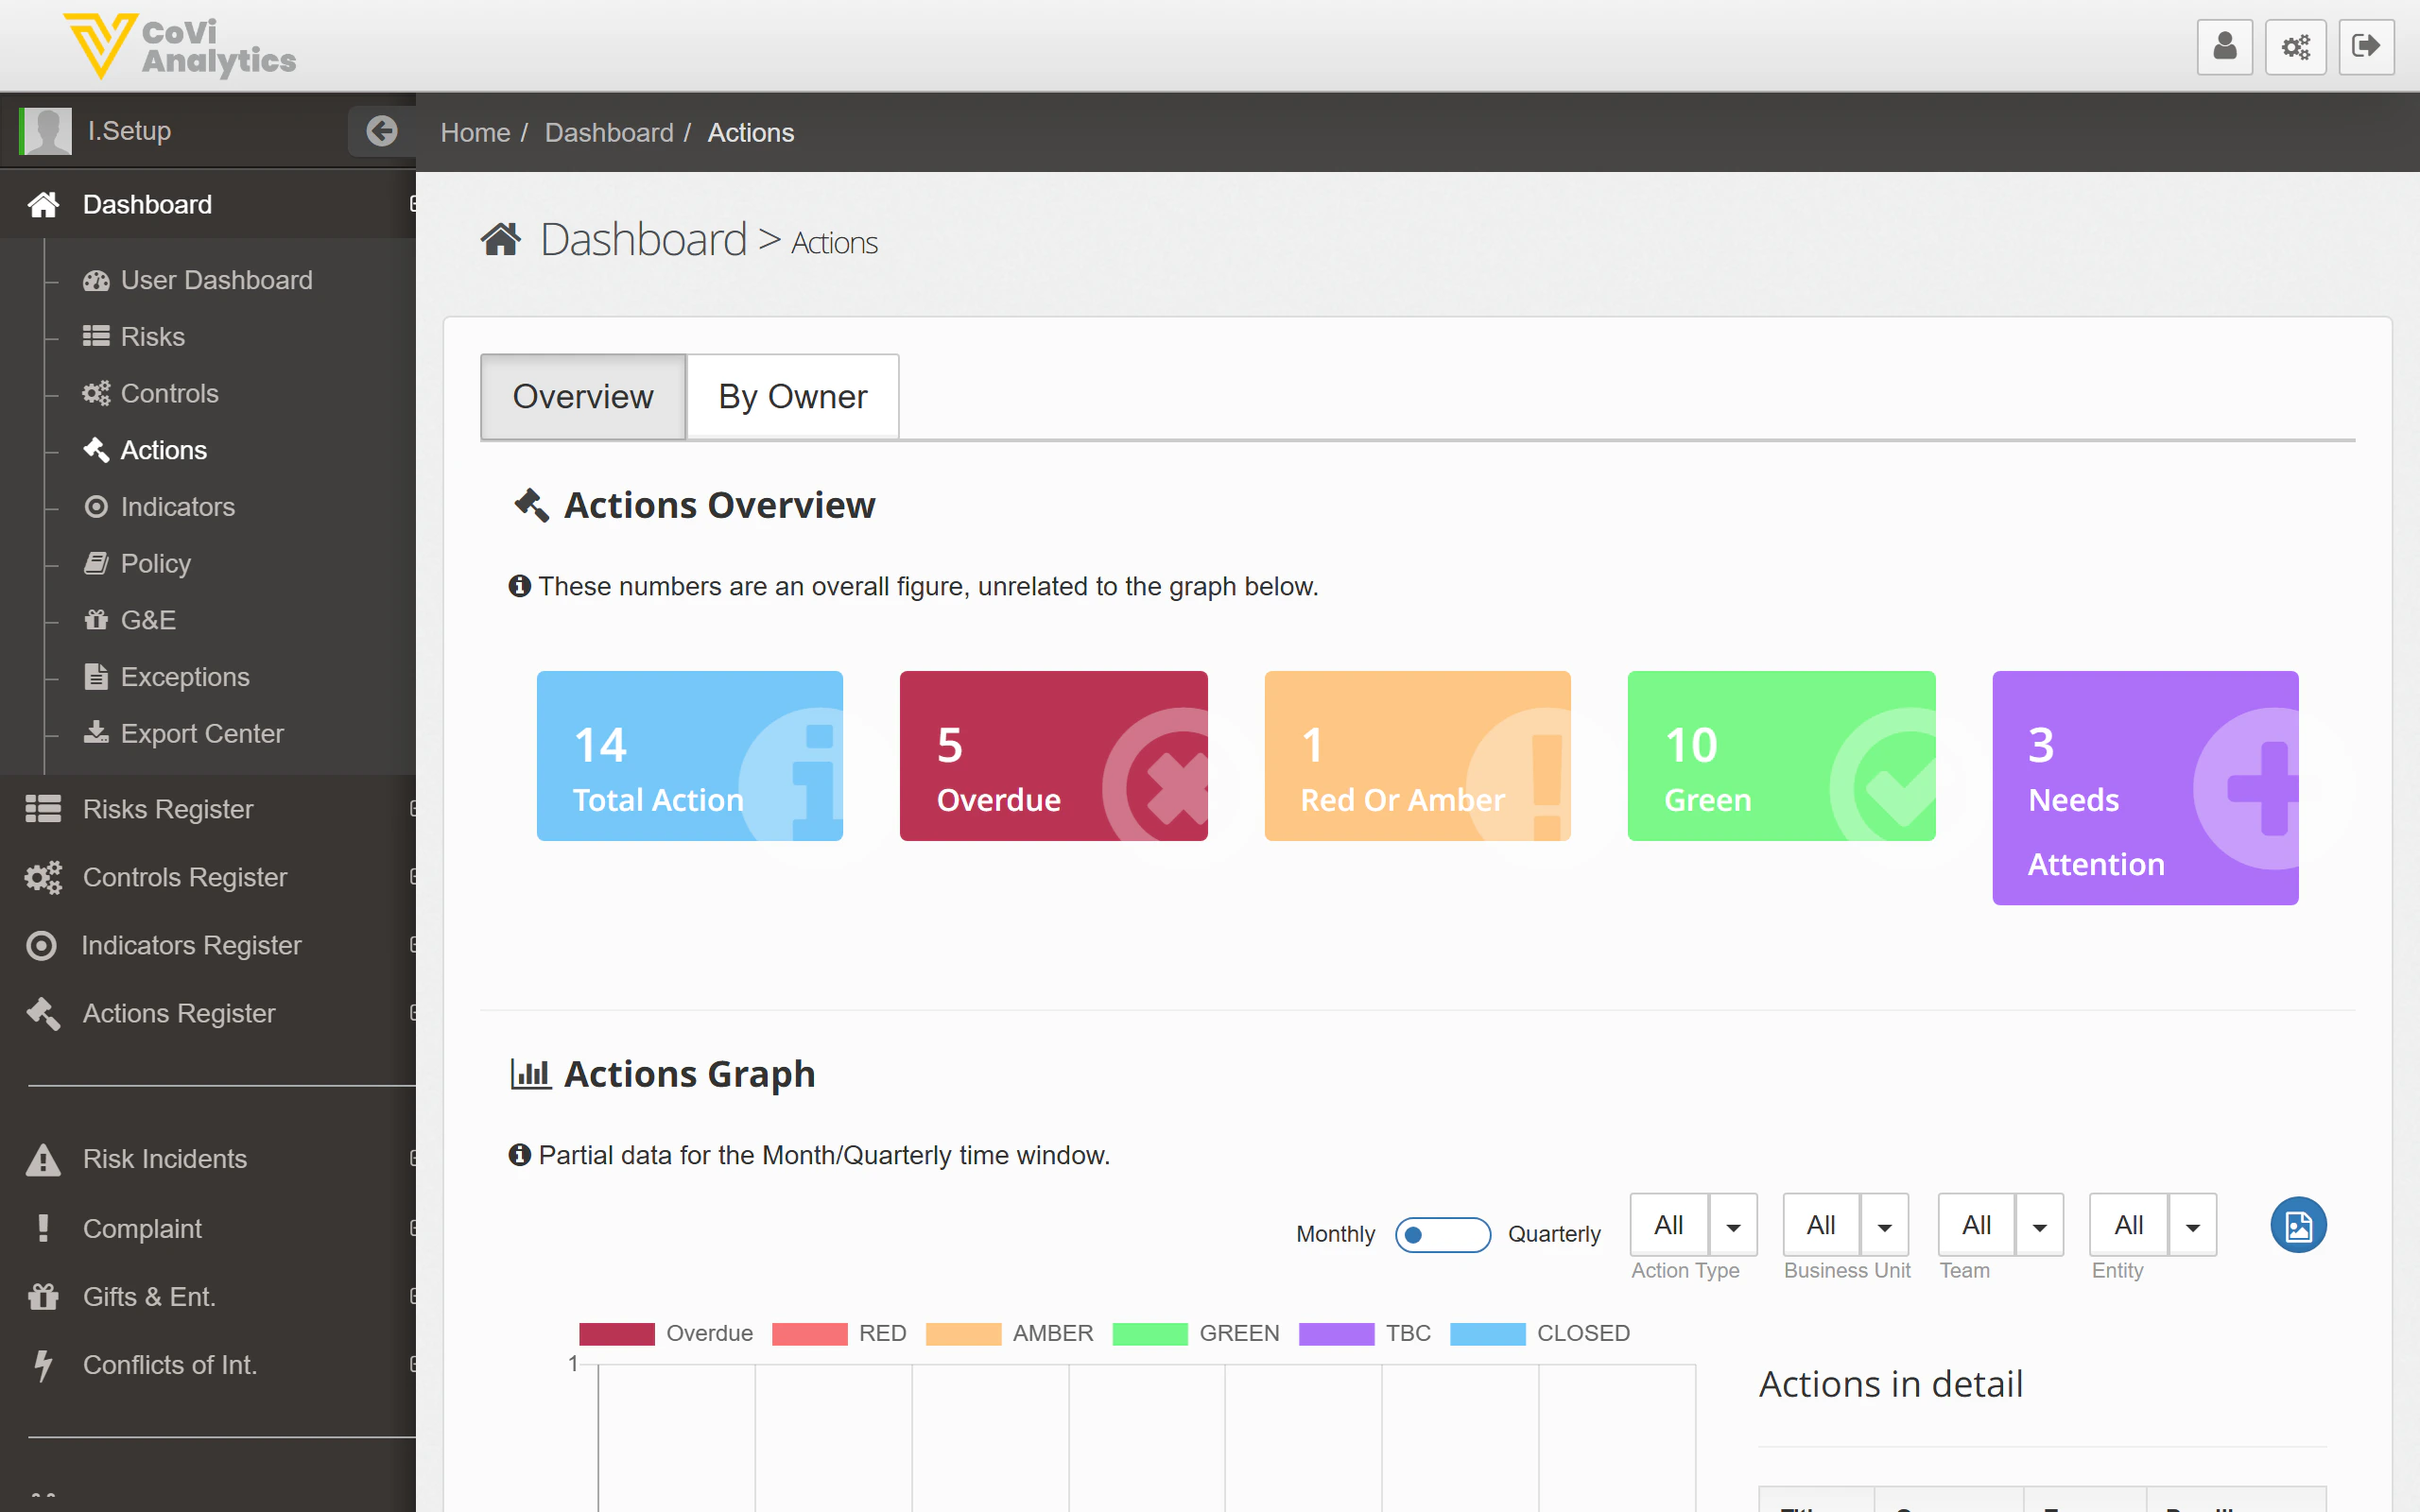
The Actions Dashboard gives you a snapshot of how your actions are progressing across the organisation. Use it to quickly identify overdue actions, spot RAG status trends, and understand which areas need attention — without having to open individual action records.
You can reach this page by clicking **Actions** in the sidebar.
 ## How to use it
### Status tiles
The coloured tiles at the top show key metrics at a glance:
* **Total Actions** — the total number of actions across all entities (e.g., 14)
* **Overdue** — actions past their due date that need immediate attention (e.g., 5)
* **Red or Amber** — actions rated as underperforming or at risk (e.g., 1)
* **Green** — actions on track and operating as expected (e.g., 10)
* **Needs Attention** — actions flagged for follow-up (e.g., 3)
Click any tile to filter the view below to just those actions.
### Dashboard tabs
Use the tabs to change how actions are grouped:
* **Overview** — the default summary with status tiles and a trend graph
* **By Owner** — see how actions are distributed across owners, useful for workload balancing
### Actions Graph
The bar chart shows action status over time. Use the toggle to switch between **Monthly** and **Quarterly** views. The dropdown filters let you narrow by:
* **Action Type** — focus on a specific category of action
* **Business Unit** — filter to a particular business area
* **Team** — narrow to a specific team's actions
* **Entity** — view actions for a single legal entity
### Actions in detail
The table at the bottom lists individual actions with their key details. Click any row to open that action's full record in the [Action Card](/actions/action-card).
## Tips & Tricks
Start your day on the **Overview** tab — if the Overdue count is climbing, switch to **By Owner** to see who needs support.
Use the **Quarterly** toggle before board reporting to show progress over longer periods. The trend graph makes a strong visual for committee packs.
The graph filters remember your selection within your session. If the graph looks unexpected, check that the filters haven't been narrowed from a previous view.
The Actions Dashboard follows the same layout as the [Controls Dashboard](/controls/dashboard). If you are familiar with one, you will find the other straightforward to navigate.
## How to use it
### Status tiles
The coloured tiles at the top show key metrics at a glance:
* **Total Actions** — the total number of actions across all entities (e.g., 14)
* **Overdue** — actions past their due date that need immediate attention (e.g., 5)
* **Red or Amber** — actions rated as underperforming or at risk (e.g., 1)
* **Green** — actions on track and operating as expected (e.g., 10)
* **Needs Attention** — actions flagged for follow-up (e.g., 3)
Click any tile to filter the view below to just those actions.
### Dashboard tabs
Use the tabs to change how actions are grouped:
* **Overview** — the default summary with status tiles and a trend graph
* **By Owner** — see how actions are distributed across owners, useful for workload balancing
### Actions Graph
The bar chart shows action status over time. Use the toggle to switch between **Monthly** and **Quarterly** views. The dropdown filters let you narrow by:
* **Action Type** — focus on a specific category of action
* **Business Unit** — filter to a particular business area
* **Team** — narrow to a specific team's actions
* **Entity** — view actions for a single legal entity
### Actions in detail
The table at the bottom lists individual actions with their key details. Click any row to open that action's full record in the [Action Card](/actions/action-card).
## Tips & Tricks
Start your day on the **Overview** tab — if the Overdue count is climbing, switch to **By Owner** to see who needs support.
Use the **Quarterly** toggle before board reporting to show progress over longer periods. The trend graph makes a strong visual for committee packs.
The graph filters remember your selection within your session. If the graph looks unexpected, check that the filters haven't been narrowed from a previous view.
The Actions Dashboard follows the same layout as the [Controls Dashboard](/controls/dashboard). If you are familiar with one, you will find the other straightforward to navigate.