> ## Documentation Index
> Fetch the complete documentation index at: https://docs.covianalytics.com/llms.txt
> Use this file to discover all available pages before exploring further.
# Risks Dashboard
> Get a high-level view of all risks across your organisation, identify overdue items, and explore risk distribution.
## Overview
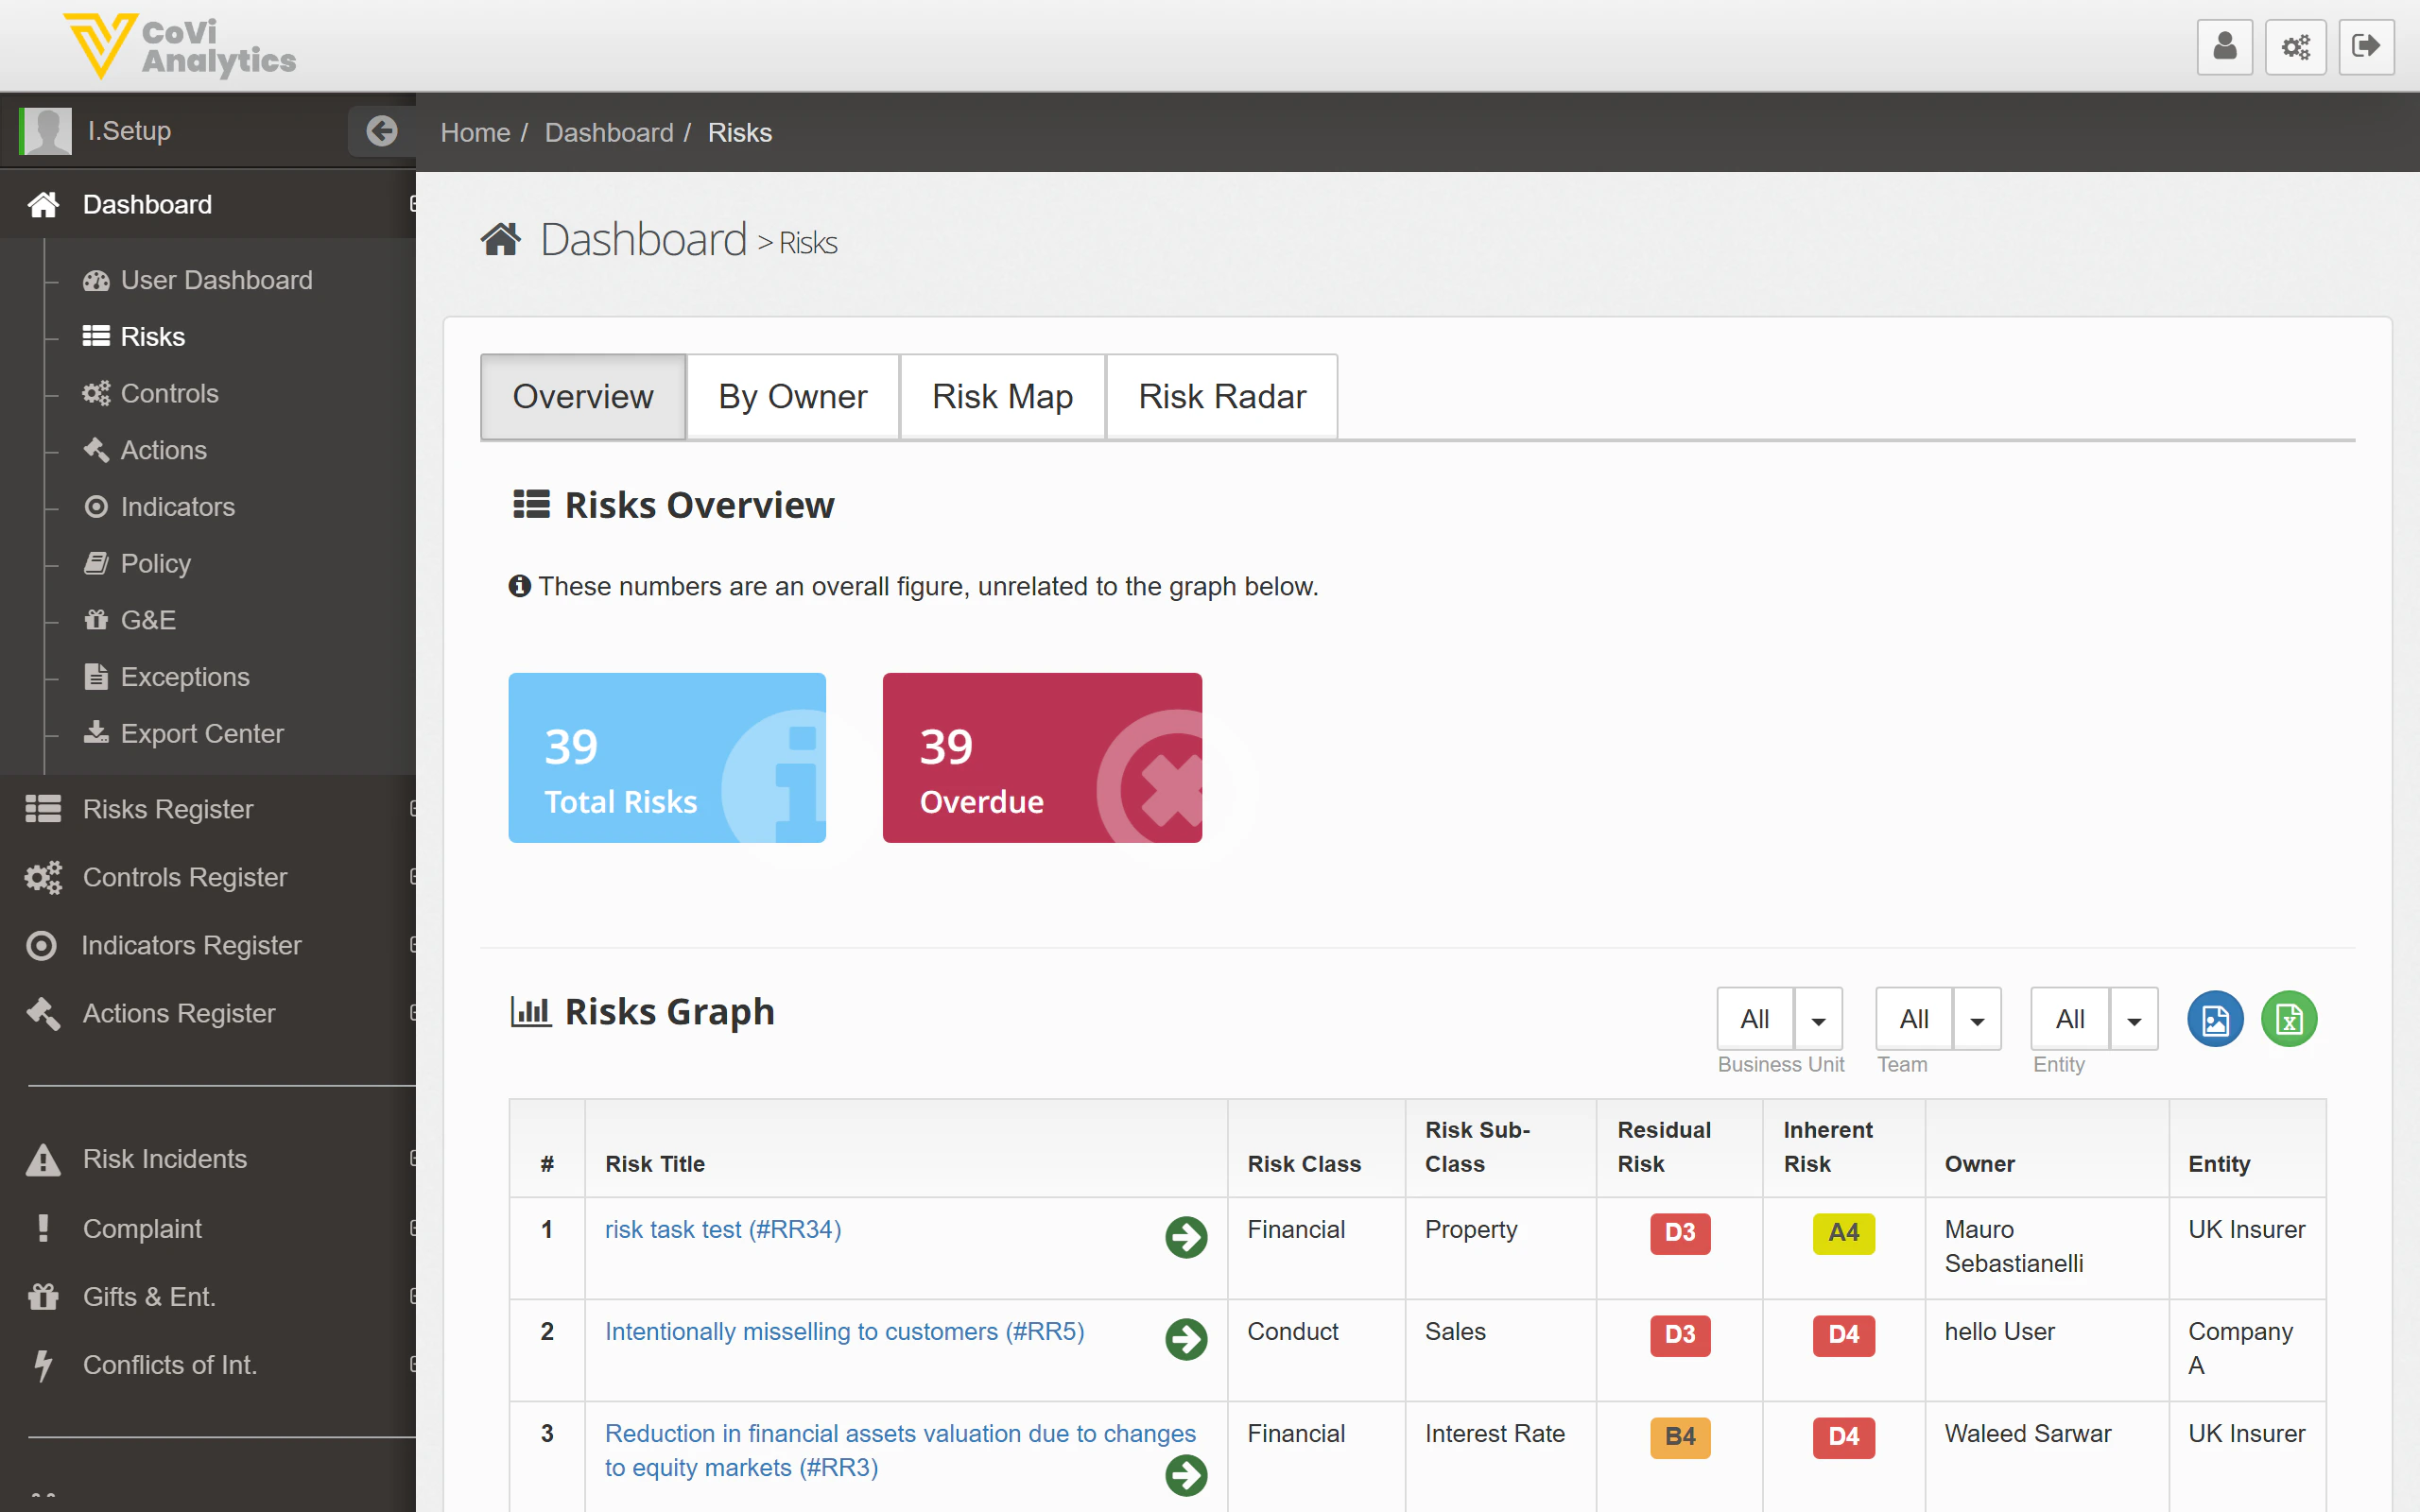
The Risks Dashboard gives you a consolidated picture of your organisation's risk landscape. Use it to track total risk counts, spot overdue reviews, explore how risks are distributed across owners and entities, and visualise risk concentrations on a heat map or radar chart — all without opening individual risk records.
You can reach this page by clicking **Risks** in the sidebar.
 ## How to use it
### Status tiles
The tiles at the top give you an at-a-glance summary:
* **Total Risks** — the total number of risks recorded across all entities (e.g., 39)
* **Overdue** — risks past their review date that need immediate attention
Click any tile to filter the view below to just those risks.
### Dashboard tabs
Use the tabs to change how risk data is presented:
* **Overview** — the default summary with status tiles, a trend graph, and a detail table
* **By Owner** — see how risks are distributed across risk owners, useful for identifying concentration or workload imbalances
* **Risk Map** — a heat map plotting risks by likelihood and impact, so you can see where your highest-rated risks cluster
* **Risk Radar** — a radar chart showing risk distribution across risk classes, giving you a quick visual of where your organisation carries the most exposure
### Risks Graph
The bar chart shows risk status over time. Use the dropdown filters above the graph to narrow by Risk Class, Business Unit, Team, or Entity. This is especially useful when preparing reports for a specific committee or legal entity.
### Risk detail table
The table at the bottom lists individual risks with key information:
| Column | What it shows |
| ------------------ | ------------------------------------------------------------------------------------------------------------------ |
| **Risk Title** | The risk name and reference (e.g., "risk dask test (RR54)") — click to open the full [Risk Card](/risks/risk-card) |
| **Risk Class** | The top-level risk category (e.g., Financial, Operational) |
| **Risk Sub-Class** | The more specific classification within the class (e.g., Property, Credit) |
| **Residual Risk** | The risk score after controls are applied (e.g., D3) |
| **Inherent Risk** | The risk score before controls are considered (e.g., A4) |
| **Owner** | The person responsible for managing this risk |
| **Entity** | The legal entity or business unit the risk belongs to |
Click any row to navigate to that risk's full record.
## Tips & Tricks
Start with the **Overview** tab each morning. If the Overdue count is rising, switch to **By Owner** to see which risk owners need support or a reminder.
Use the **Risk Map** tab before board or committee meetings. The heat map gives a powerful visual summary of where risk is concentrated — it works well in presentation packs.
The **Risk Radar** tab is useful for identifying blind spots. If one risk class is heavily populated and another is empty, it may indicate gaps in your risk identification process rather than a genuine absence of risk.
The graph filters persist within your session. If the data looks unexpected, check that the filters have not been narrowed from a previous view.
## How to use it
### Status tiles
The tiles at the top give you an at-a-glance summary:
* **Total Risks** — the total number of risks recorded across all entities (e.g., 39)
* **Overdue** — risks past their review date that need immediate attention
Click any tile to filter the view below to just those risks.
### Dashboard tabs
Use the tabs to change how risk data is presented:
* **Overview** — the default summary with status tiles, a trend graph, and a detail table
* **By Owner** — see how risks are distributed across risk owners, useful for identifying concentration or workload imbalances
* **Risk Map** — a heat map plotting risks by likelihood and impact, so you can see where your highest-rated risks cluster
* **Risk Radar** — a radar chart showing risk distribution across risk classes, giving you a quick visual of where your organisation carries the most exposure
### Risks Graph
The bar chart shows risk status over time. Use the dropdown filters above the graph to narrow by Risk Class, Business Unit, Team, or Entity. This is especially useful when preparing reports for a specific committee or legal entity.
### Risk detail table
The table at the bottom lists individual risks with key information:
| Column | What it shows |
| ------------------ | ------------------------------------------------------------------------------------------------------------------ |
| **Risk Title** | The risk name and reference (e.g., "risk dask test (RR54)") — click to open the full [Risk Card](/risks/risk-card) |
| **Risk Class** | The top-level risk category (e.g., Financial, Operational) |
| **Risk Sub-Class** | The more specific classification within the class (e.g., Property, Credit) |
| **Residual Risk** | The risk score after controls are applied (e.g., D3) |
| **Inherent Risk** | The risk score before controls are considered (e.g., A4) |
| **Owner** | The person responsible for managing this risk |
| **Entity** | The legal entity or business unit the risk belongs to |
Click any row to navigate to that risk's full record.
## Tips & Tricks
Start with the **Overview** tab each morning. If the Overdue count is rising, switch to **By Owner** to see which risk owners need support or a reminder.
Use the **Risk Map** tab before board or committee meetings. The heat map gives a powerful visual summary of where risk is concentrated — it works well in presentation packs.
The **Risk Radar** tab is useful for identifying blind spots. If one risk class is heavily populated and another is empty, it may indicate gaps in your risk identification process rather than a genuine absence of risk.
The graph filters persist within your session. If the data looks unexpected, check that the filters have not been narrowed from a previous view.