Overview
The Business Processes Map provides a visual, flowchart-style representation of your business processes. Each process is displayed as a series of connected nodes, showing how activities flow from one step to the next. Use this page to design, review, and refine your process maps so that teams understand their responsibilities and regulators can see your operational structure.How to use it
Selecting a process
Use the Search Process dropdown in the top-right corner to choose which process to display. The dropdown shows the process reference and name (e.g. “PR1 - Capital Model Run”). Once selected, the map updates to show that process’s workflow.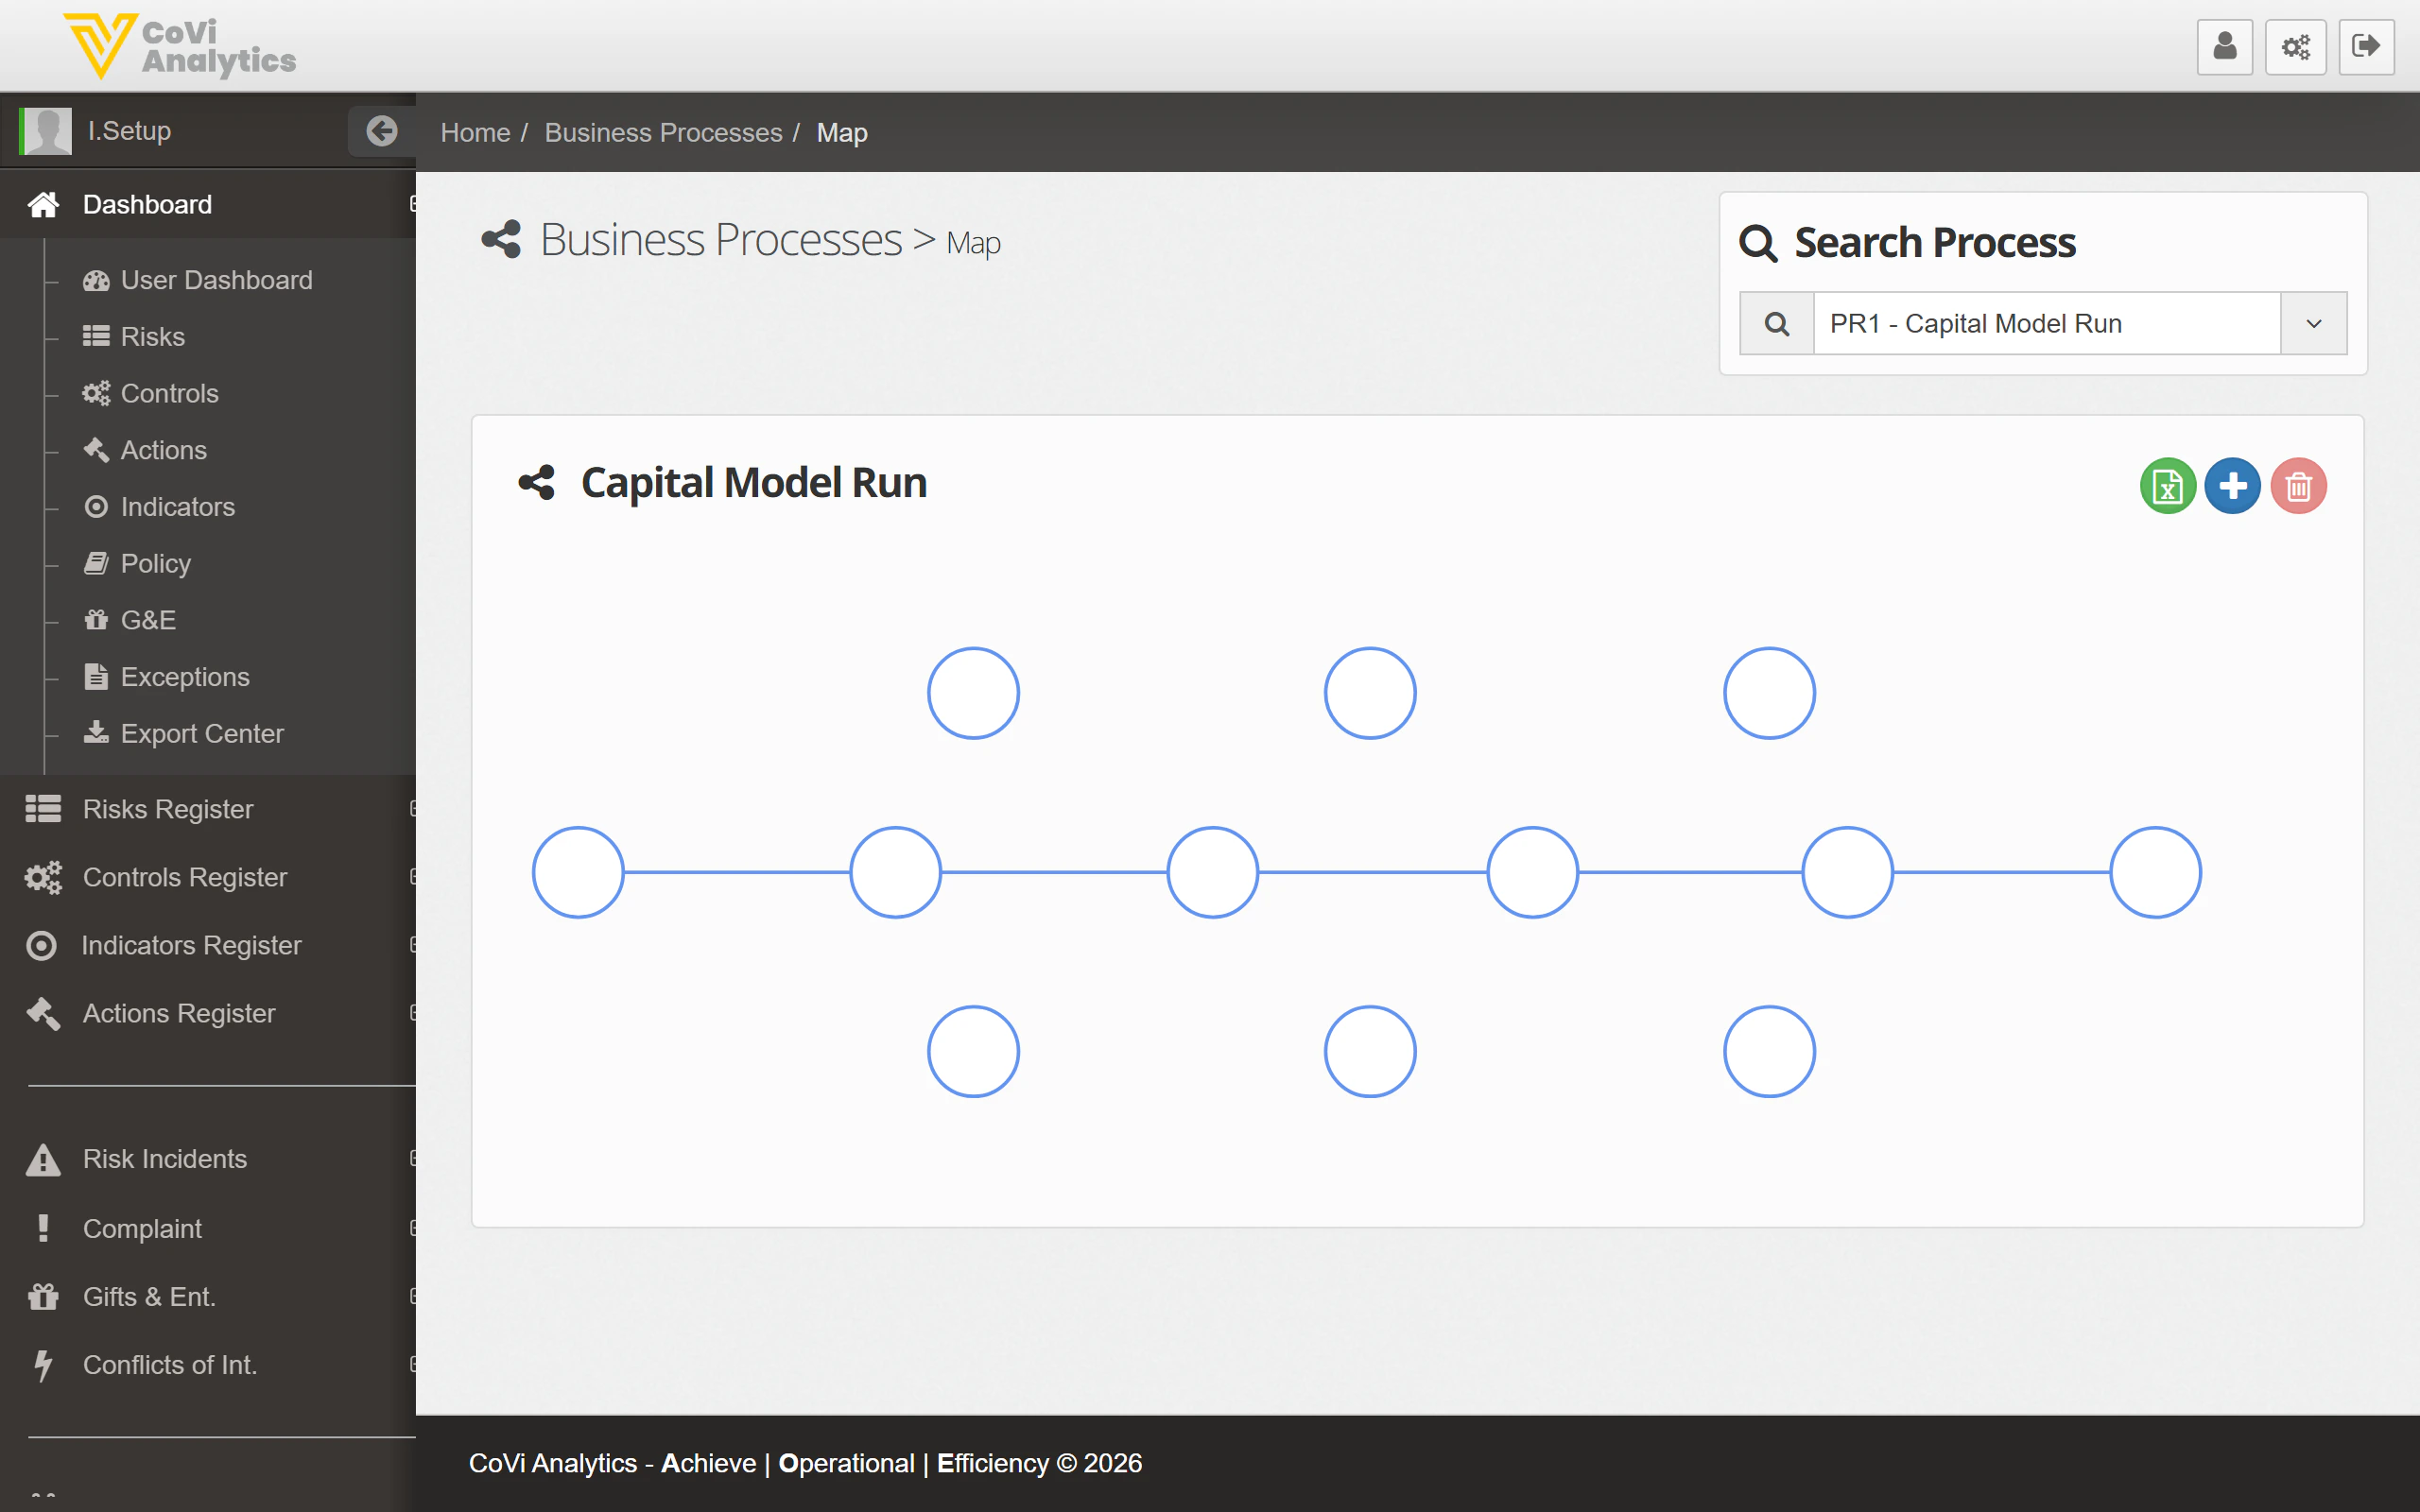
Reading the map
The map displays each activity as a node (circle) connected by lines that indicate the sequence of steps. Follow the lines from left to right (or top to bottom, depending on the layout) to understand the order in which activities are performed. Each node represents a discrete activity within the process. Click on a node to view its details, including the assigned owner, linked risks, and associated controls.Editing the map
Use the action buttons in the toolbar to modify the process map:- Home — Reset the view to the default zoom and position.
- Add — Add a new activity node to the process. You can then drag it into position and connect it to other nodes.
- Delete — Remove the selected node from the map. This also removes any connections to and from that node.
Navigating the map
For large processes with many nodes, use your mouse scroll wheel to zoom in and out. Click and drag on an empty area of the canvas to pan across the map.Tips & Tricks
Changes to the map are saved when you confirm them. If you are experimenting with a new layout, you can navigate away without saving to discard your changes.