Overview
The Policy Dashboard gives you an at-a-glance picture of your organisation’s policy landscape. Use it to track how many policies are current, which are overdue for review, and how policy activity trends over time. Whether you need a high-level summary or want to drill into individual policy owners, the dashboard brings everything together in one place.How to use it
Status tiles
At the top of the dashboard you will see summary tiles showing key metrics:- Total Policy — the total number of policies in the system (e.g. 35).
- Overdue — the number of policies that have passed their scheduled review date without being updated (e.g. 31).
Dashboard tabs
The dashboard offers three views, accessible via tabs at the top of the page:Overview
The default tab. Displays the status tiles and the Policies Graph (described below), giving you a broad snapshot of policy health.By Owner
Groups policies by the individual responsible for each one. Use this view to identify owners with a disproportionate number of overdue reviews, or to rebalance policy ownership across your team.Policy Wall
A visual board-style layout that arranges policies by status. Useful for team meetings or steering committees where you want to walk through the portfolio quickly.Policies Graph
Below the status tiles, a bar or line chart shows policy activity over time. You can toggle between:- Monthly — aggregates policy events by calendar month.
- Quarterly — aggregates by quarter, useful for board-level reporting cycles.
- Business Unit — restrict to a specific business unit.
- Team — restrict to a specific team within a business unit.
- Entity — restrict to a specific legal entity.
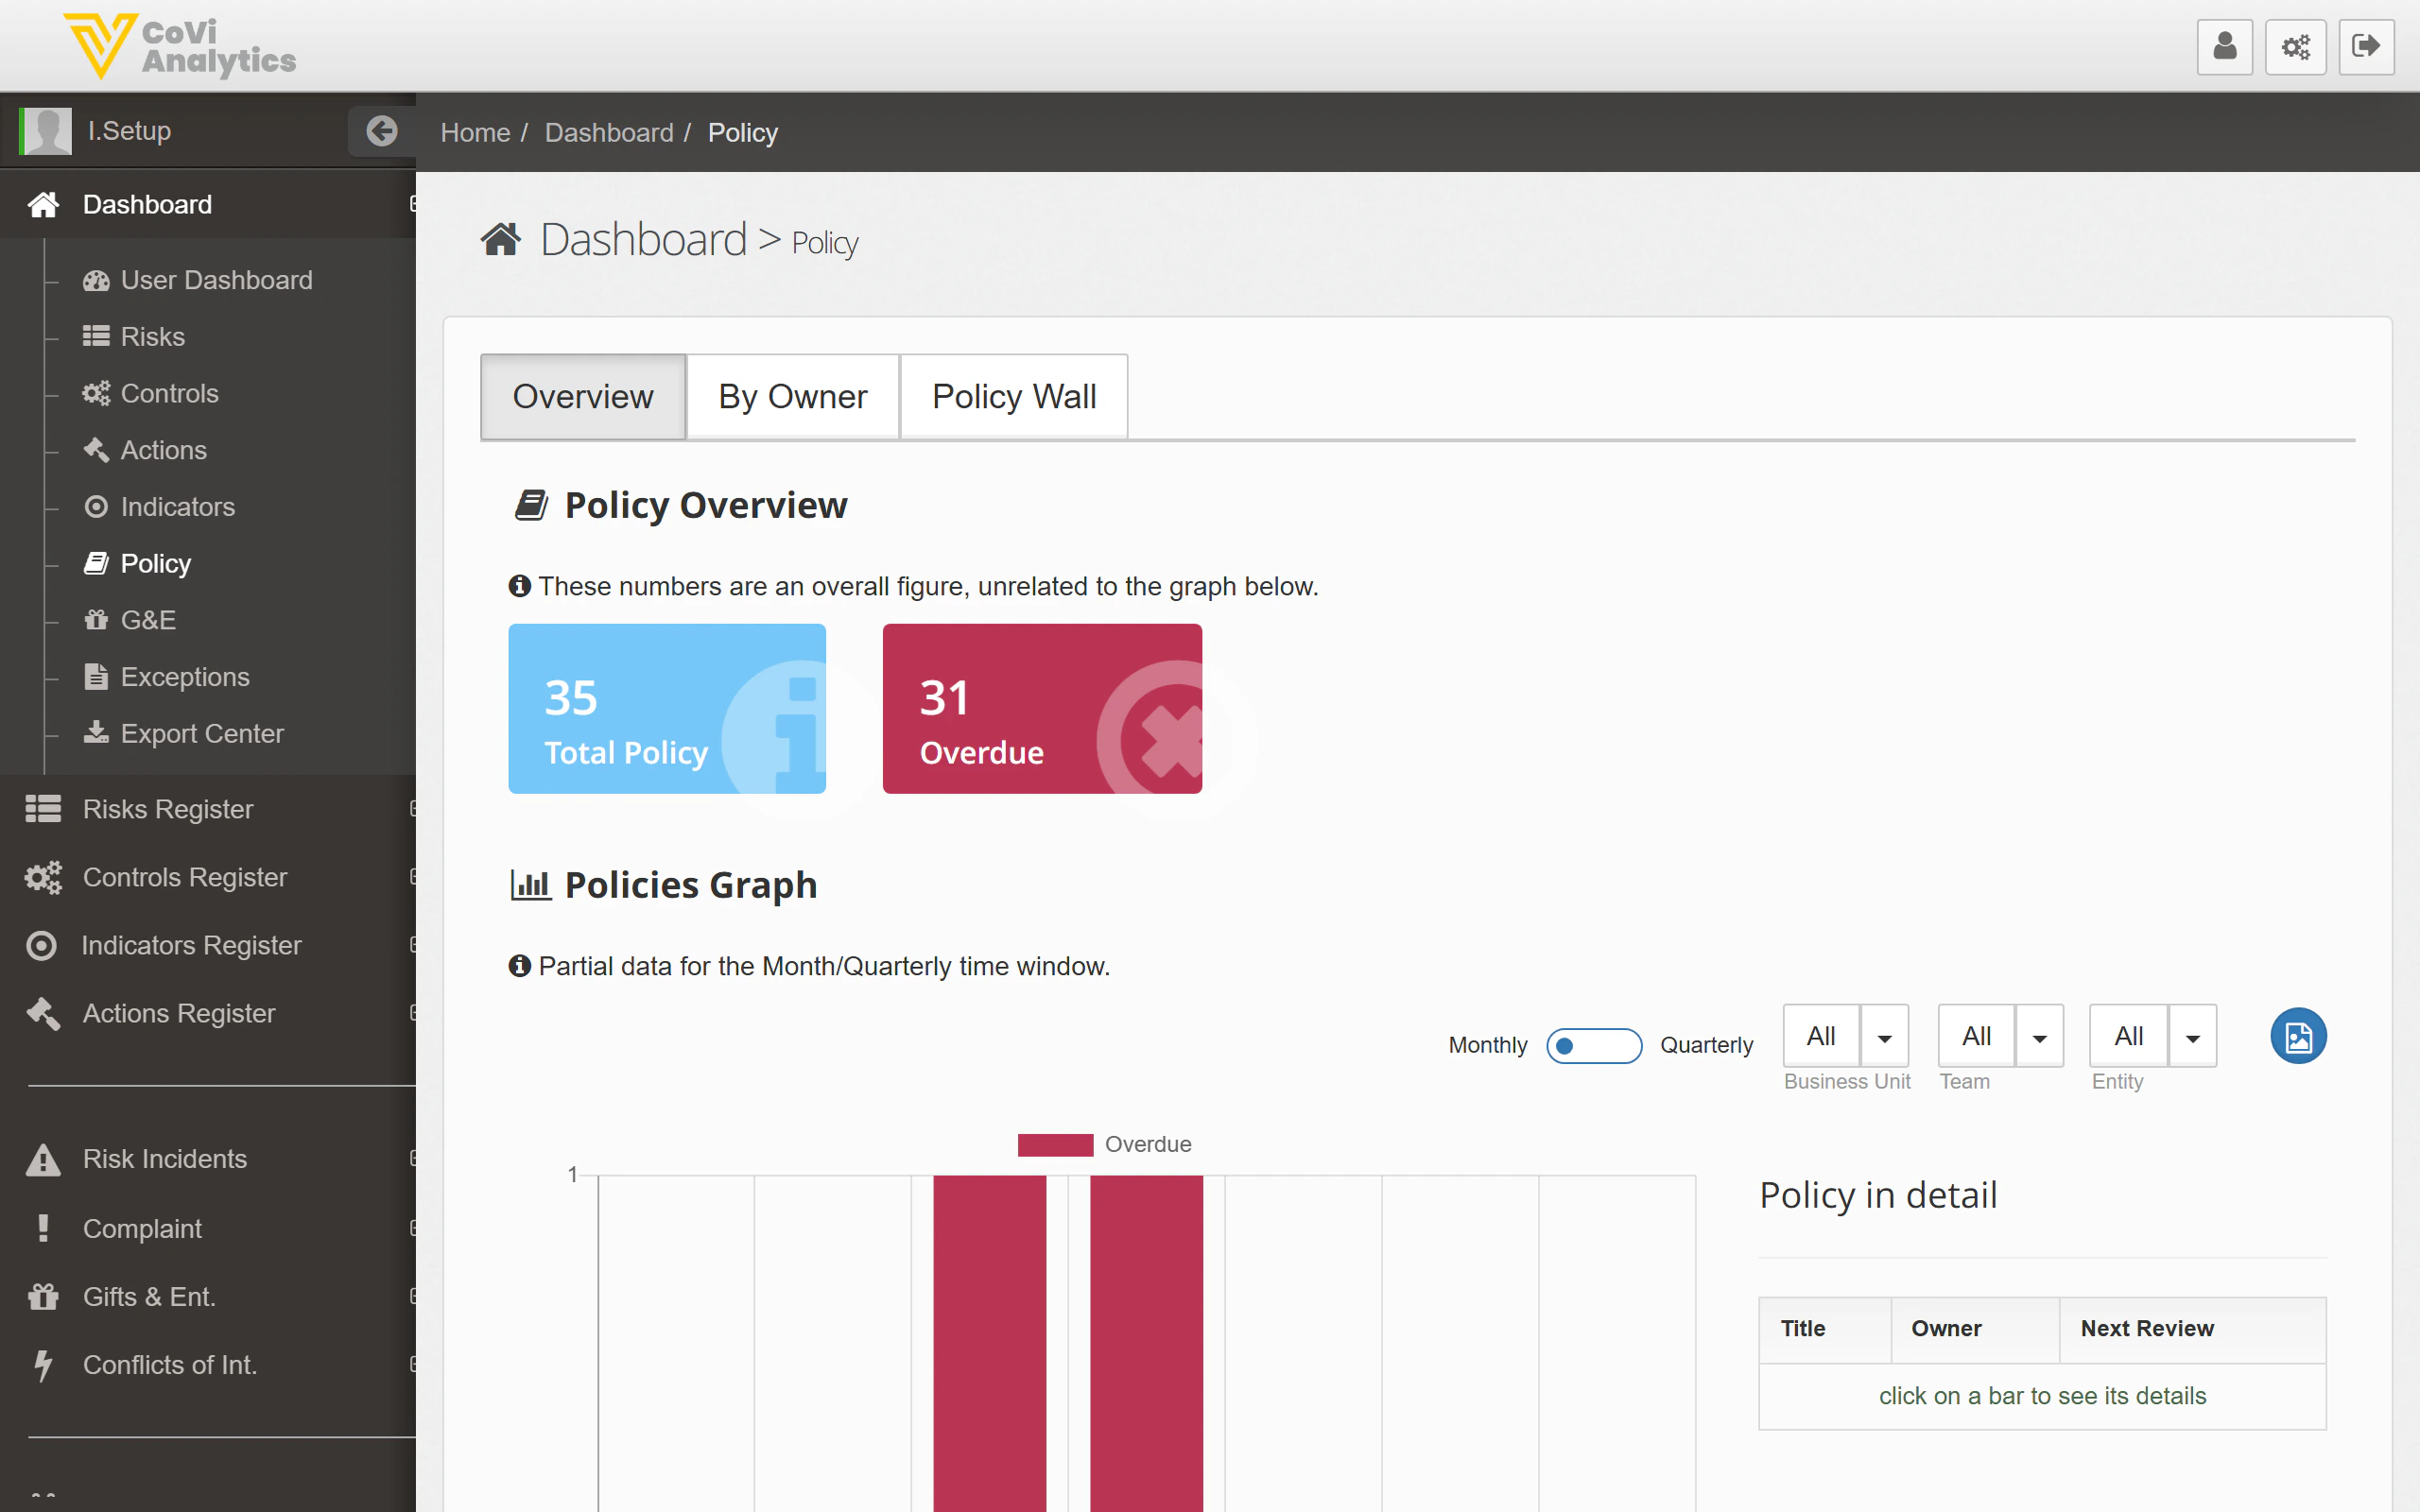
Policy in detail table
Beneath the graph, the Policy in detail table lists every policy with the following columns:
You can sort by any column header and use the filters above the graph to narrow the table to a specific business unit, team, or entity.
Tips & Tricks
Filters applied to the Policies Graph also affect the Policy in detail table below it. Clear all filters to return to the full organisational view.